Returns Needed to Achieve Different Goals
What compound real rate of return does your portfolio have to earn to achieve your target income and savings/bequest goals? Sadly, too many retired investors cannot answer this question.
So let's deal with it straight away. Given these goals, as well as your expected remaining years of life, you can derive the minimum compound annual real rate of return your portfolio must earn to meet them. To make this process even simpler, we've calculated the following tables.
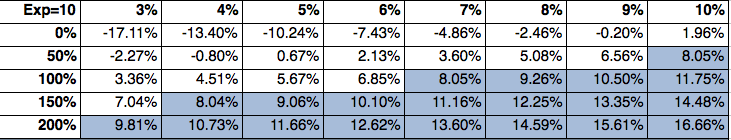
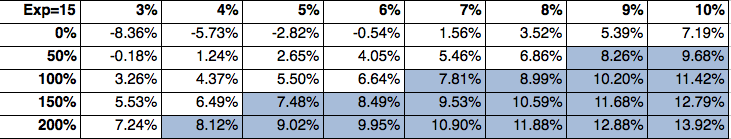
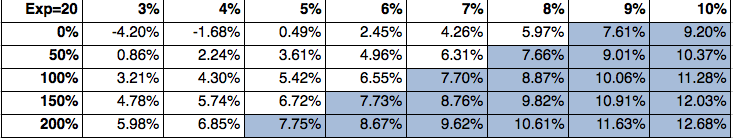
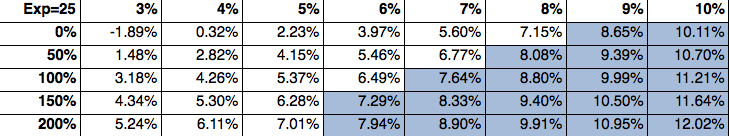
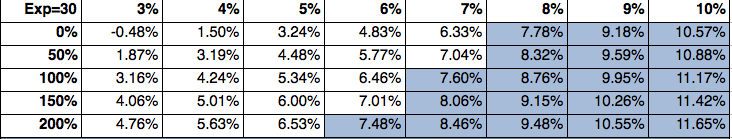
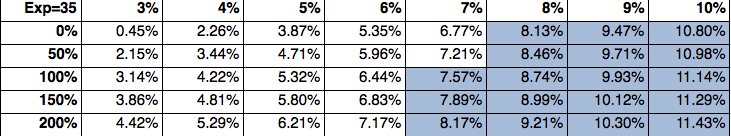
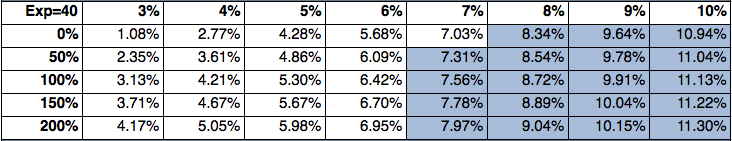
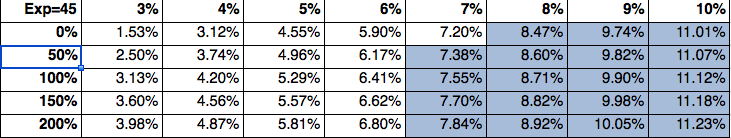
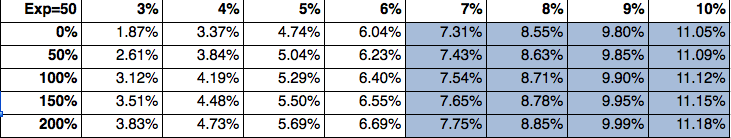
Here is how to use them. In the upper left cell of each section, "Exp =" refers to your estimate of your remaining years of expected life. The top line of each section contains a series of numbers, ranging from 3% to 10%. These represent your target income, expressed as a percentage of the starting value of your portfolio. Along the left side of each section is a series of numbers ranging from 0% to 200%. These represent your target bequest/savings goal, also expressed as a percentage of the starting value of your portfolio.
Within each expected life section, at the intersection of each target income and target bequest goal, you will find the minimum compound annual real return that your portfolio must earn. If, over your expected remaining life, your portfolio earns this compound annual rate of return, it should end with a value of zero after your bequests are paid out.
For example, suppose you expect to live for twenty more years. The target income you want your portfolio to produce equals 5% of its initial value. You also would like to leave bequests equal to 100% of your portfolio's current value after you die. The table shows that achieving these goals requires that you earn a compound annual real rate of return (also called the geometric average) of at least 5.42% on your portfolio over this period.
There are three key points to keep in mind about these returns. First, they are real returns, and do not include inflation. We use real returns because it focuses attention on maintaining the purchasing power of your income and savings over time. When people focus on nominal returns, high inflation can cause them to think they are doing quite well, even as the purchasing power of their portfolios shrink.
Second, these returns are after-tax. To convert these returns to a pre-tax basis, divide them by an amount equal to 1 less your marginal tax rate.
Third, in order to achieve this 5.42% compound annual return, your average annual return will have to be significantly higher than this amount, because you will be investing in risky assets. When the standard deviation of annual returns (a proxy for risk) on an asset or portfolio is greater than zero, its simple (arithmetic) average annual rate of return will be higher than its compound average rate of return over time (also known as its geometric average return). This is due to a phenomenon called either "variance drain" or "volatility drag."
This is an important concept that too few investors clearly understand.
Here's another example that should help make it clear. Consider an investment that over five years earns annual returns of 10%, 5%, (20%), (5%), and 25%. Over this five year period, the arithmetic average return on this investment is 3.00%. The standard deviation of these returns is 16.81%. Because of this variability, the compound average annual return over this five year period is only 1.87%.
A quick (if not perfectly accurate) estimate of the impact of volatility drag (that is, the difference between the arithmetic average annual return on an investment and the actual compound annual return you are likely to earn) is that it is equal to one half the square of volatility (that is, it is equal to one half the variance, which is the same thing as the standard deviation squared). In our example, this method yields an estimated compound return of 1.59%, which is reasonably close to the actual 1.87% figure.
One last point: The shaded cells in the table show real compound annual rates of return that, based on our view of historical experience, seem imprudent to expect in the future. In general, the lower the required compound annual real rate of return, the higher the probability that wise asset allocation, investment selection, and risk management will result in its achievement.
** Note: The compound annual real returns shown in this table are calculated using the internal rate of return method. We assume that the next year's target income requirement is taken out at the end of each year.
Hence, a portfolio initially worth $1,000 and a target income of 5% starts the first year of our simulation with a value of $950. A portfolio that achieves its target compound annual real rate of return ends up with a zero balance after its bequest goal has been met at the end of the expected lifetime.
Once you have quantified the goals and calculated the compound real rate return your portfolio must earn to achieve them, you need to implement a plan to achieve it. The allocation of your assets is a critical element of this plan, to which we will now turn.
Let's proceed to What Asset Allocation is Right for You?
